Technical Analysis
A method of evaluating securities by relying on the assumption that market data, such as charts of price, volume, and open interest, can help predict future (usually short-term) market trends. Unlike fundamental analysis, the intrinsic value of the security is not considered. Technical analysts believe that they can accurately predict the future price of a commodity by looking at its historical prices and other trading variables. Technical Analysis is the forecasting of future financial price movements based on an examination of the past price movements. Like weather forecasting, technical analysis does not result in absolute predictions about the future. Instead, technical analysis can help investors anticipate what is "likely" to happen to prices over time. Technical analysis uses a wide variety of charts that show price over time.
Support and Resistance:
Support and Resistance represents key levels where demand and supply meet. Prices are driven by excessive demand and supply. Demand is synonymous with bulls & buying. Supply is synonymous with bears & selling. If the levels are broken, the relationship between demand and supply has changed.
Support:
Price levels at which the demand is strong enough to prevent it from declining further are called Support Levels. It normally lies below the current price. As price declines towards support, buyers become more inclined to buy and sellers become less inclined to sell. When price reaches support level, demand will overcome supply, preventing prices from further decline.
Resistance:
Price levels at which selling is strong enough to prevent the prices from rising further are called Resistance Levels. It normally lies above the current price. As price rises towards resistance, sellers become more inclined to sell and buyers become less inclined to buy. When price reaches resistance level, supply will overcome demand, preventing prices from further rise.
MACD (Moving Average Convergence / Divergence):
The MACD is used to determine overbought or oversold conditions in the market. Written for stocks and stock indices, MACD can be used for commodities as well. The MACD line is the difference between the long and short exponential moving averages of the chosen item. The signal line is an exponential moving average of the MACD line. Signals are generated by the relationship of the two lines. As with RSI and Stochastic, divergences between the MACD and prices may indicate an upcoming trend reversal.
RSI - Relative Strength Index:
This indicator is often used to identify price tops and bottoms by keying on specific levels (usually "30" and "70") on the RSI chart, which is scaled from 0-100. It can also help in detecting support and resistance levels. It may be noted that failure swings above 70 or below 30 can warn of coming reversals. Divergence between the RSI and price is often a useful reversal indicator The formula for calculating the RSI is: • RSI=100-(100/1-RS) • RS= average of x day’s up closes divided by average of x day’s down closes
Major CandleStick Patterns:
Doji:
The Doji is one of the most revealing signals in Candlestick trading. It clearly indicates that the Bulls and the Bears are at equilibrium, a state of indecision. The Japanese say that whenever a Doji appears, always take notice. The Doji signal is comprised of one candle. It is formed when the open and the close occur at the same level or very close to the same level in a specific timeframe. In candlestick charting, this essentially creates a cross formation. As the following illustration demonstrates, the horizontal line represents the open and close occurring at the same level. The vertical line represents the total trading range during that time.
GraveStone Doji:
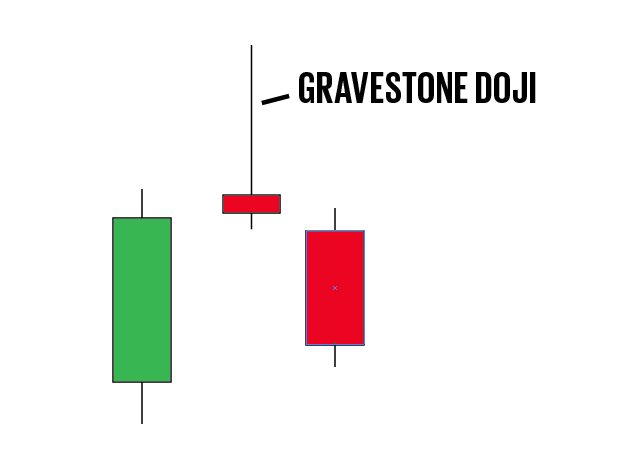
The Gravestone Doji is formed when the open and the close occur at the low of the day. It is found occasionally at market bottoms, but its forte is calling market tops. The name, Gravestone Doji, is derived by the formation of the signal looking like a gravestone.
DragonFly Doji:
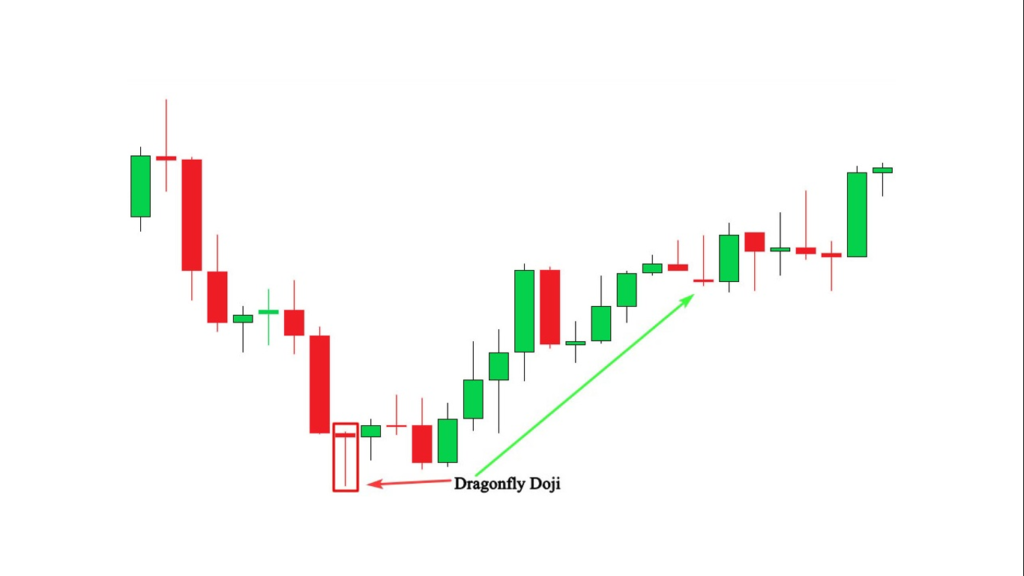
The Dragonfly Doji is formed when the open and the close occur at the top of the day. It is found occasionally at market top, but its forte is calling market bottom. The name, Dragonfly Doji, is derived by the formation of the signal looking like a dragonfly about to take off.
Bullish Engulfing Pattern:
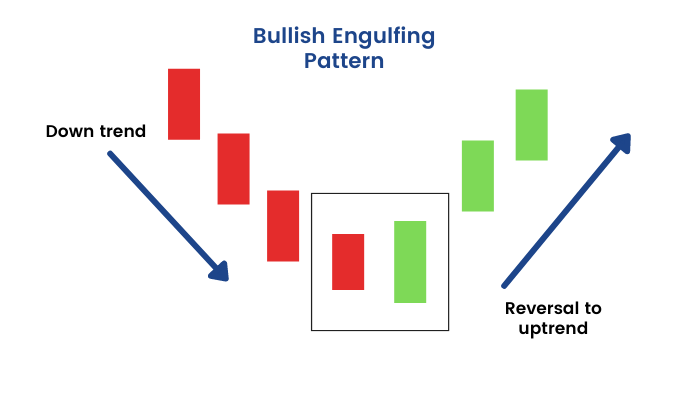
The Bullish Engulfing Pattern is formed at the end of a downtrend. A bullish candle is formed that opens lower and closes higher than the bearish candle open and close from the previous day. This complete engulfing of the previous day's body represents overwhelming buying pressure, which dissipates the selling pressure.
Bearish Engulfing Pattern:
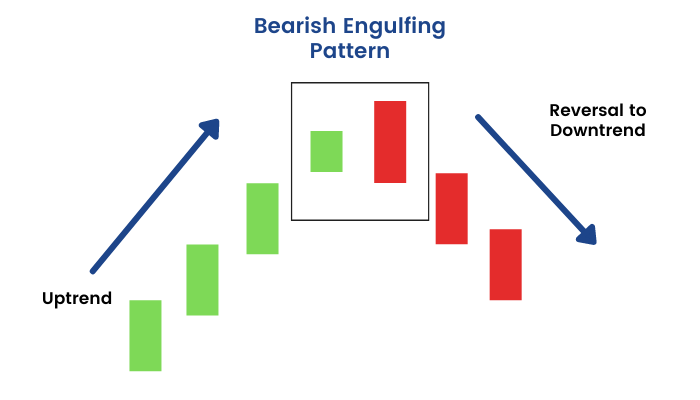
The Bearish Engulfing Pattern is directly opposite to the bullish pattern. It is created at the end of an up-trending market. The bearish candle completely engulfs the previous day's bullish candle. This shows that the bears are now overwhelming the bulls.
Dark Cloud Cover:
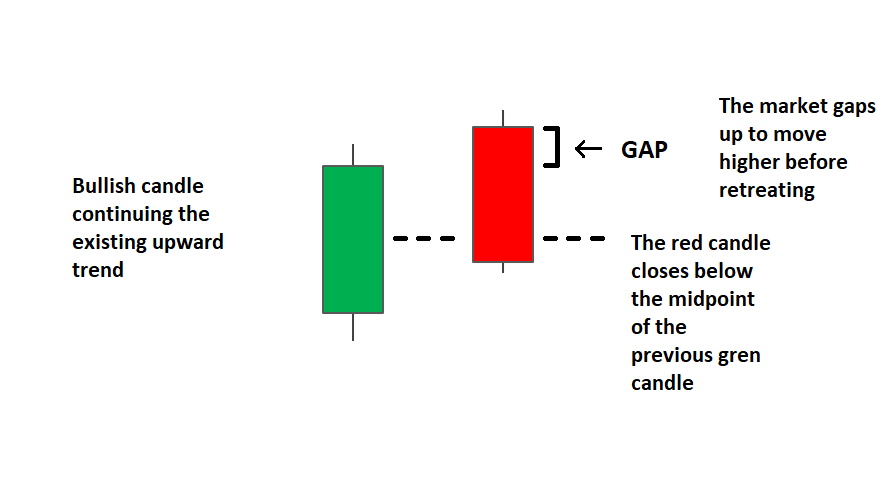
The Dark Cloud Cover is a two-day bearish pattern found at the end of an upturn or at the top of a congested trading area. The first day of the pattern is a strong bullish candle. The second day's price opens higher than any of the previous day's trading range. The formation of the bearish candle confirms the reversal of the bullish trend.
Piercing Pattern:
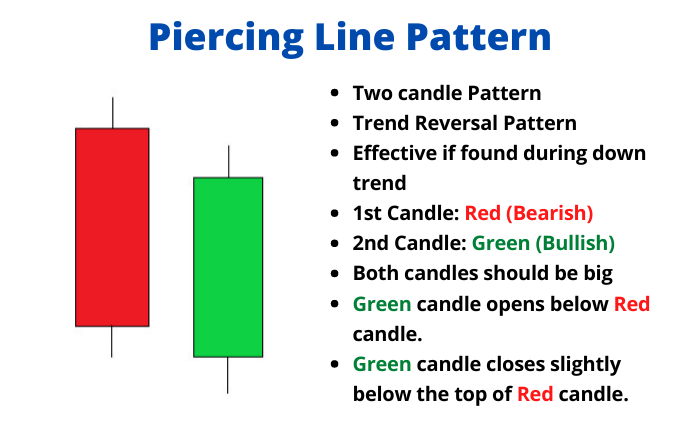
The Piercing Pattern is a bottom reversal. It is a two candle pattern at the end of a declining market. The first day confirms the formation of a bearish candle. The second day is a bullish candle. The bullish candle opens sharply lower, under the trading range of the previous day. The price comes up to where it closes above the 50% level of the bearish candle.
Hammer and Hanging Man:
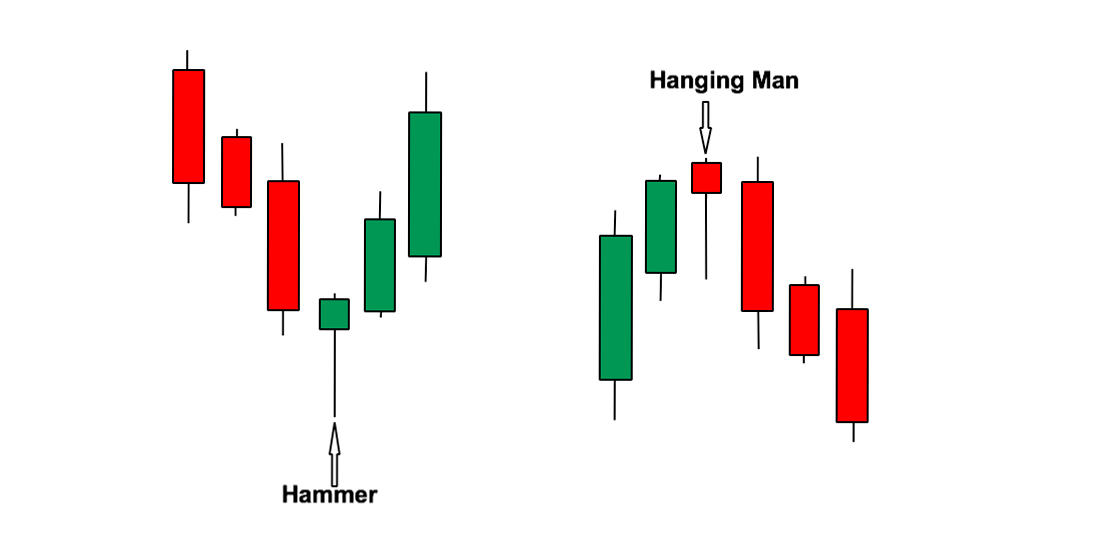
Hammer and Hanging-man are candlesticks with long lower shadows and small real bodies. The bodies are at the top of the trading session. This pattern at the bottom of the down-trend is called a Hammer. It is hammering out a base. The Japanese word is takuri, meaning "trying to gauge the depth".
Morning Star:
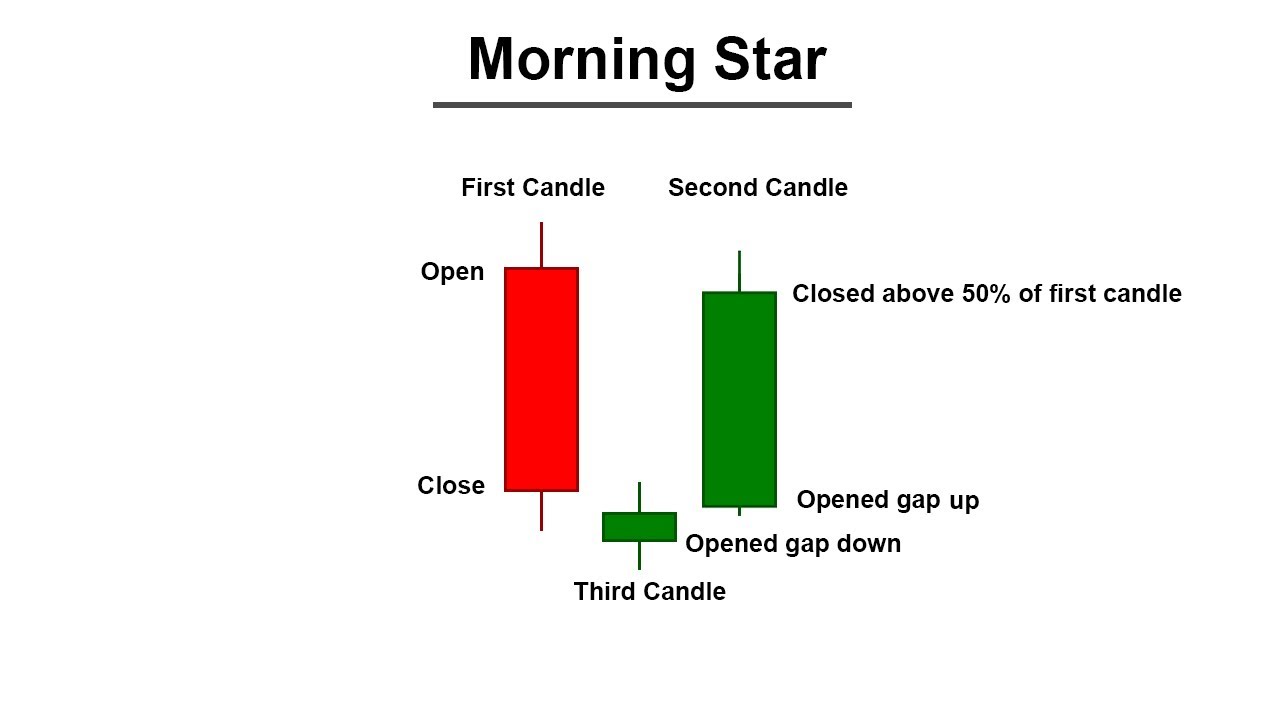
The Morning Star is a bottom reversal signal. Like the morning star, the planet Mercury, it foretells the sunrise, or the rising prices. The pattern consists of a three day signal.
Evening Star:
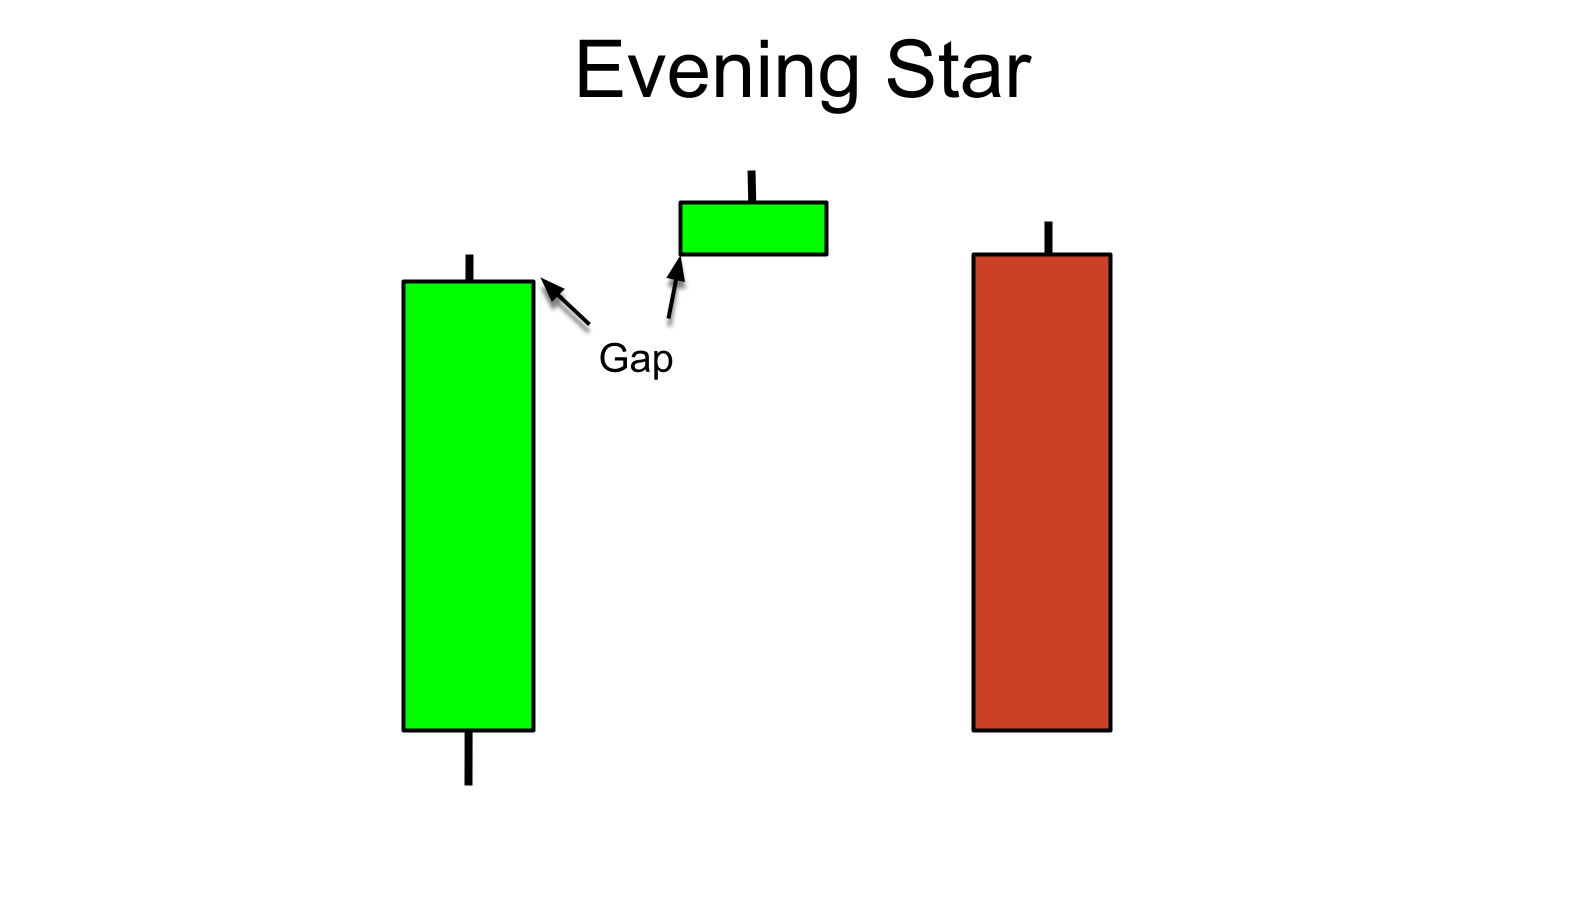
The Evening Star is the exact opposite of the morning star. The evening star, the planet Venus, occurs just before the darkness sets in. The evening star is found at the end of the uptrend.
Shooting Star:
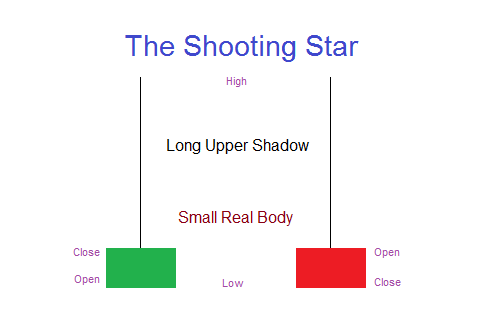
A Shooting Star sends a warning that the top is near. It got its name by looking like a shooting star. The Shooting Star Formation, at the bottom of a trend, is a bullish signal. It is known as an inverted hammer. It is important to wait for the bullish verification.